
The Triangle of Everything
On Presenting the Facts of Science


I became acquainted with a primitive version of the Triangle of Everything in a 1974 issue of Sky & Telescope magazine, in which it was credited as originating from a Princeton University study. The version presented in this essay was created by illustrator Alex Van de Sande,1 and is much more detailed while retaining the essence of the original:
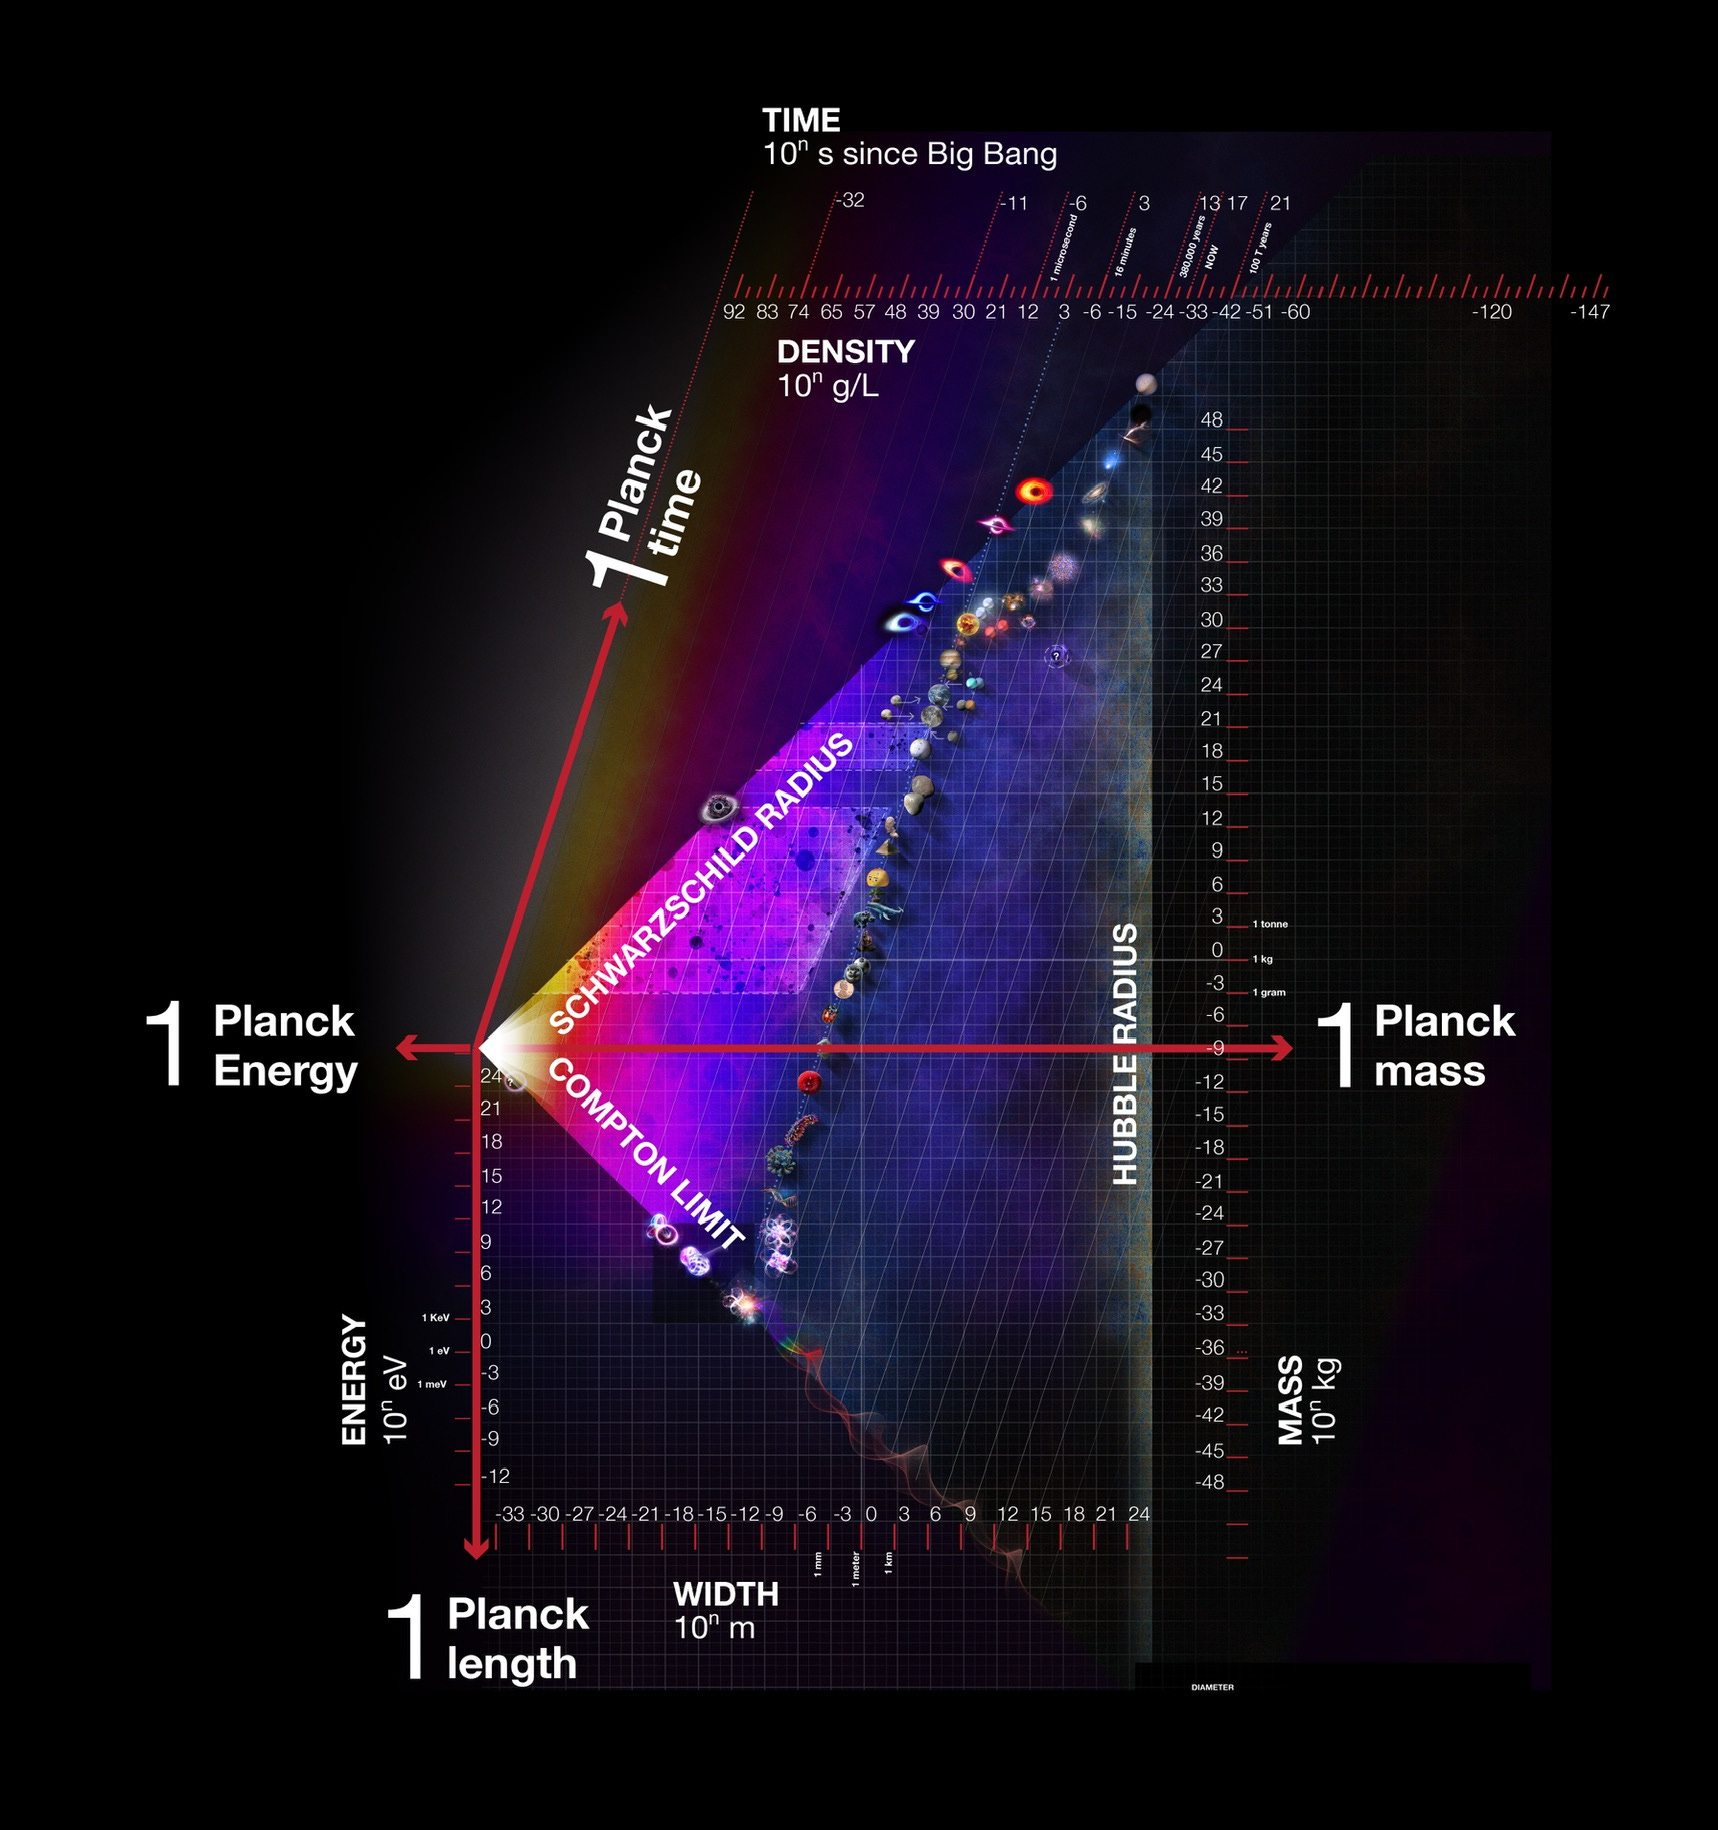
Literally everything in the observable universe is inside this triangle, which plots objects’ size (meters), mass (kilograms), density (grams per liter), energy (electron volts) and time (seconds).
At right is the Hubble Radius, the physical limit to the observable universe.2 There may be stars and galaxies beyond it, but since light travels at a finite speed in vacuum the universe is simply not old enough for us to see past it. There is a colored representation of the cosmic microwave background (CMB) running in front of the line. It is named for astronomer Edwin Hubble.
At top left is the Schwartzchild Radius. This is the size of a black hole of a given mass.3 The addition of mass to a black hole does not push it above the line, it merely shifts it upward along the line. Nothing can exist above that line. It was invented by astronomer Karl Schwartzchild.
At bottom left is the Compton Limit.4 No subatomic particle can exist below it. Pump energy into a particle to push it below the line and it will create two particles that then pop back over the line. Nothing can exist below that line. It is named for physicist Arthur Compton.
At left is the Planck length. Nothing can exist that is smaller, i.e. to the left of the line. It touches the left vertex of the Triangle, where Schwartzchild Radius and the Compton Limit meet. It is named for physicist Max Planck, who invented it.
In the original 1974 version the Compton Limit was not used, instead near this location was a line of the mass equivalence of photons. The first step to determine this line was to use the Planck-Einstein relation to find the photons’ energies, where h is the Planck constant and f the frequency (yes, this is the same frequencies from our car radios - the higher the frequency, the more energy it has):
and then use the energies of the photons to find their mass equivalences via this reshuffling of Albert Einstein’s famous equation in which c is the speed of light:
So the mass result is used to plot the vertical positions of the photons on the chart. The horizontal position on the chart, the length, is also known via the frequency-wavelength conversion that was verified by Heinrich Hertz:
It turns out that there is a direct relationship between the Compton Limit and Einstein’s equation (but somewhat more mathematically complex than the three equations above), the two lines would be parallel on this illustration and very close, with the Compton Limit the lower of the two. For our purposes the meaning of the Compton Limit is more significant. Still, this illustration plots electromagnetic radiation (radio, visible light, gamma rays, etc) along the Limit, with visible light properly color-coded. The implication of this is clear, but still a mouthful: increasing the energy of a photon will decrease its wavelength and increase the mass equivalence, and eventually the photon’s mass equivalence will nearly equal the mass of a black hole with a Schwartzchild Radius equal to the photon’s wavelength. That is downright weird, but it does make sense once we get used to it.
Note also that there is a faint dotted and slanted line at the top of the illustration. This is the density of water, and by following the line downward we can see that nearly everything from stars to viruses lies close to this line. Only small atoms and galaxies have densities too low to fit.

But there is much more to this illustration.
Max Planck created his constant h to explain the observed evidence that energy from a blackbody radiator is quantized. He then proceeded to use h, the speed of light in vacuum c, the Newtonian gravitational constant G, and the Boltzmann thermodynamic constant k to create fundamental units of length, mass, time, and temperature. They are fundamental because they are not based on an arbitrary value such as the length of a king’s arm or a fraction of the estimate of the earth’s diameter; they are derived instead from fundamental constants of nature. These have been called Planck units.
The Planck units have been added to this illustration. Most of these numbers are either very small or large and therefore are outside normal everyday human experience (Click here to see the precise values of the Planck units and their derivations from the fundamental constants - my apologies, but trying to add them directly to this essay would be a monumental task). The reader can closely approximate the Planck units values by looking on the chart for the metric counterparts which line up with them. Let us explore what they mean.
The Planck length is the smallest possible length in our universe. Again, nothing can exist that is smaller. Trying to visualize it results in physicists describing space at that level as a ‘quantum foam.’ If it were possible to visualize a photon of light crossing space at that level, the observer would not see it moving smoothly through space, but rather ‘jumping’ from one location to the next.
The Planck time is the time it takes a photon in vacuum to cross the Planck length. It is the smallest possible unit of time.
When the universe was 1 Planck time old after the Big Bang, its diameter was 1 Planck length and its temperature was the highest possible, namely 1 Planck temperature. It is impossible for us to know what the universe was like when it was less that 1 Planck time old, at least until we invent a functioning theory of quantum gravity (no, we haven’t). On the chart the Big Bang is represented by the light at the intersection of the Schwartzchild Radius and the Compton Limit.
The Planck energy on the chart is the Planck temperature without the Boltzmann constant; it’s used because it is a better visual fit for the mass-energy equivalence of the Compton Limit.
The one Planck unit that has a 'human-world’ size is the Planck mass. Roger Penrose has speculated that the Planck mass is the dividing line between the classical and quantum worlds. He has conceptually designed a counter-top laboratory instrument to test this idea, but so far we lack the technology to build it.
Do I fully understand all this? No. But I do appreciate the beauty that it hints at and the ingenuity by which it has been brought to us. We discover fundamental values for everyday events such as an apple falling from a tree (Newton) or why certain temperatures emit certain colors of light (Planck) and they lead rather simply via Planck’s units to a description of the beginning of our universe. We can only conclude that this is something deep and profound: like the CMB, the fundamental constants in effect are residual fingerprints of our origins.
For more on Alex Van de Sande see https://en.wikipedia.org/wiki/User:Avsa?rdfrom=commons:User:Avsa
The Hubble radius is the speed of light divided by the Hubble constant (though it is only constant for a given time), which is the rate of expansion of the universe:

The Schwarzschild radius is:


This essay is a good argument for why Planck's name should be as well known to the general public as Newton or Einstein.